IN Brief:
- Long Beach reported 997,177 TEU in September 2026, 25% above September 2025 and a new monthly record.
- Loaded imports were 509,390 TEU, exports 91,747 TEU and empty movements 396,040 TEU.
- The port reported smooth vessel operations, while trucking concerns and a forthcoming bridge closure require separate attention.
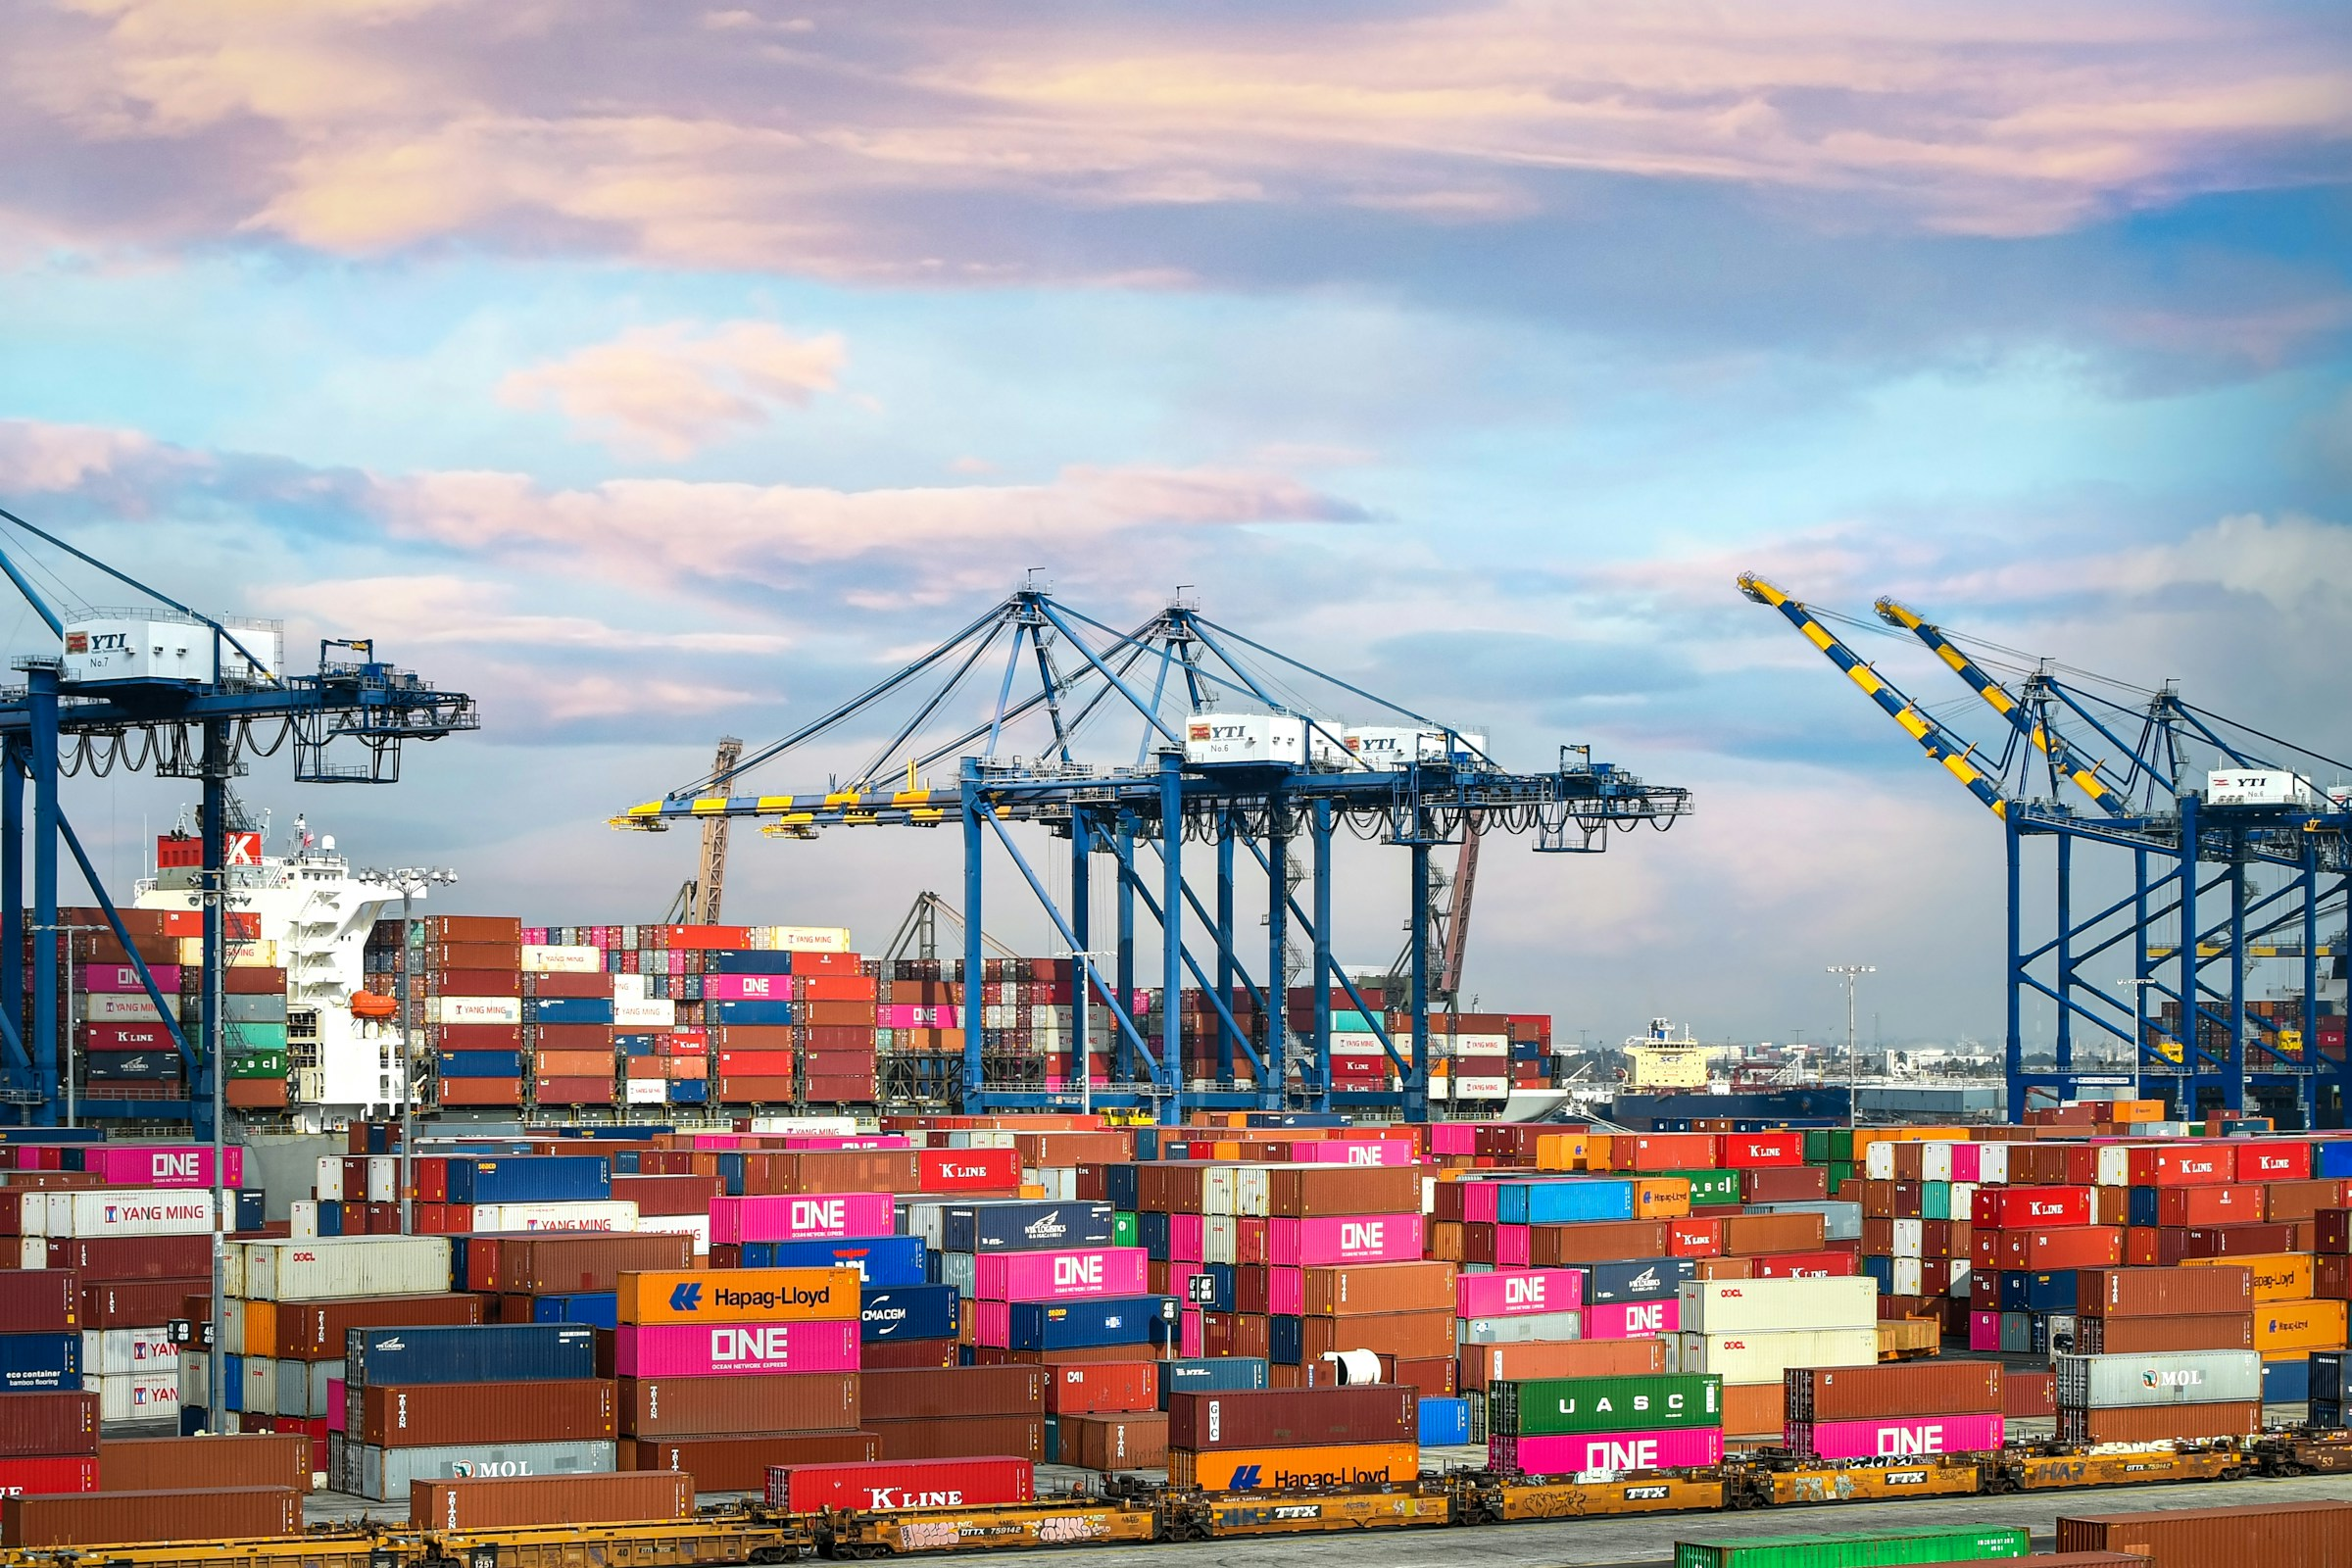
The Port of Long Beach handled a record 997,177 twenty-foot equivalent units (TEU) during September 2026, exceeding its previous monthly high of 987,191 TEU set in October 2024. The port announced the figures on 15 October during chief executive Dr Noel Hacegaba’s monthly supply chain briefing. September’s total was 25% higher than a year earlier, led by growth in loaded imports. This monthly measure describes cargo throughput, rather than installed annual handling capacity or cargo value.
Loaded inbound containers accounted for 509,390 TEU, up 31.3% year on year. Loaded exports totalled 91,747 TEU, 7.8% higher than in September 2025, while empty containers reached 396,040 TEU, a rise of 22.1%. These components add to the reported monthly total and show how strongly inbound traffic outweighed outbound loaded cargo. The port processed more than five TEU of loaded imports for every one TEU of loaded exports, although empty boxes are also an essential element of the equipment cycle.
Empty containers represented close to 40% of all the TEU handled in September. Their movement does not carry the same implications as a loaded import of raw materials, components or finished goods, but repositioning is necessary if shipping lines are to provide equipment where it is needed next. A port can therefore record a very high monthly total even as the balance between export demand, import demand and the return of empty boxes becomes less favourable to certain customers. Counting TEU alone conceals that distinction.
During the first nine months of 2026, Long Beach handled 7,675,255 TEU, up 3.9% on the corresponding period in 2025. September’s year-on-year increase was therefore substantially faster than cumulative growth across January–September. Long Beach also reported its busiest August, with 919,992 TEU handled that month. The September record is a new monthly dataset rather than a repeat of the August announcement, and neither monthly total alone establishes the ability to maintain that rate for a full year.
At the October briefing, port management attributed some of the increased traffic to cargo-routing decisions linked to high diesel costs, restrictions on Panama Canal access and expectations around a possible US–China trade agreement. Those factors were presented as commercial influences, not as a statistical decomposition of the 997,177 TEU handled. Routing decisions also depend on ocean schedules, inland delivery destinations, railway service and contracts with terminal operators. No evidence in the release identifies a numerical contribution from each of these influences.
After discharge, inbound boxes must pass through yard storage, release procedures and truck or rail collection before reaching their inland destinations. Vessel operations can proceed quickly even where hauliers struggle to secure container-return appointments, obtain a chassis or retrieve an import from a crowded stack. September’s higher inbound and empty-container movements therefore place additional demands on yard-space allocation, gate scheduling and coordination between terminals, shipping lines and inland operators. The port’s total TEU figure alone does not measure how long those individual steps took.
Port management characterised vessel operations as free of the congestion associated with earlier cargo surges. Reporting from the 15 October briefing also recorded concerns from trucking representatives about the accumulation of empty containers, the availability of return locations and disputes over charges. These statements concern different stages of the freight process: a vessel can berth without waiting at anchor while a haulier still experiences delays at a gate or has difficulty returning an empty box. Neither viewpoint should be converted into an independently verified assessment of every truck movement during the month.
Total Terminals International recorded 59,410 rail moves in September, which Hacegaba identified as a terminal monthly record. The port also described the activity as representing nearly half of that terminal’s container volume. Because the published account does not set out the unit conversion behind the percentage, the figure should remain attributed to the port and should not be recast as a verified port-wide rail modal share. Rail operations need sufficient train paths, handling equipment and inland terminal capacity if additional dockside moves are to translate into prompt deliveries.
From late October, Long Beach plans additional evening and Saturday gate hours to maintain freight movements during the neighbouring Port of Los Angeles’ Vincent Thomas Bridge works. The port says its programme is due to start two weeks before the planned 7 November closure and operate for six weeks, excluding Thanksgiving week. The adjacent bridge is scheduled for a 16-month deck-replacement project. Extended gate hours are a mitigation measure, not proof that the road network, truck appointments or other port activities will be unaffected.
Loaded imports exceeded loaded exports by more than five to one during September, leaving the port heavily dependent on flows of incoming goods and the repositioning of empty equipment. US agricultural and forest-product exporters still need access to outbound containers, vessel space and inland transport to fulfil overseas orders. At the media briefing, an agriculture transport representative cautioned that tariffs and freight costs could encourage foreign buyers to seek alternative suppliers. That was a commercial warning; September’s port statistics do not measure the number of orders lost to retaliation or logistics costs.
Long Beach continues to state an ambition of handling 20 million TEU annually by 2050, around twice its intended long-term baseline. September’s nearly one million TEU indicates the volume processed in a single unusually busy month, rather than achievement of that annual goal. October’s subsequent throughput, the performance of extra gate shifts and actual rail and truck movements will show whether high waterside productivity can be maintained without transferring delays to the inland delivery network.