IN Brief:
- Estimated worldwide container-port throughput reached 1.012 billion TEU in 2025, up 8%.
- The 171 ports handling more than one million TEU processed around 884 million TEU.
- Ports below the one-million-TEU threshold collectively grew 21%, substantially faster than the largest gateways.
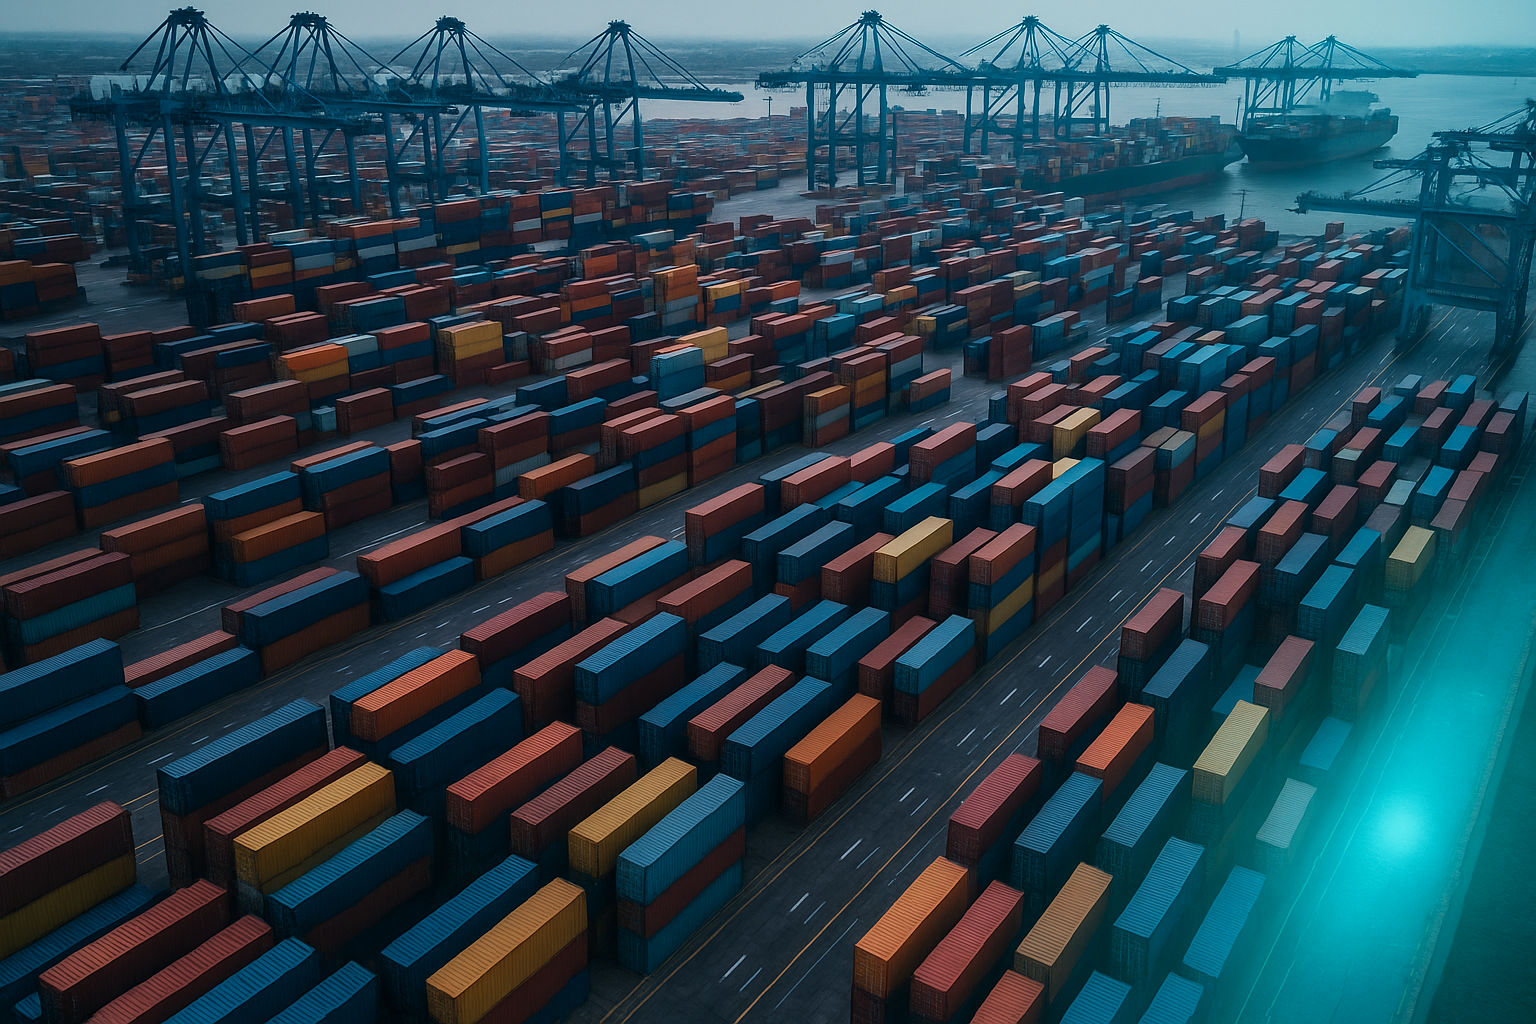
Worldwide container-port throughput reached an estimated 1.012 billion TEU in 2025, breaking the one-billion threshold as rising volumes extended beyond the largest global hubs into a broader group of regional gateways.
Figures from DynaLiners put total throughput 8% above the estimated 937.3 million TEU handled in 2024 and substantially ahead of the 876 million TEU recorded for 2023.
The data covers full and empty containers loaded and discharged from ocean-going short-sea and deep-sea vessels, including imports, exports, and transshipment. Some port figures remain estimates, and differences in reporting periods and definitions mean direct comparisons require care.
Even with those qualifications, the overall scale is significant. Container handling has moved beyond a billion TEU annually, reflecting the physical network required to support manufacturing, retail, intermediate-goods, and raw-material supply chains worldwide.
There were 171 ports handling more than one million TEU during 2025. Together, those gateways processed approximately 884 million TEU, up 6% from 830.9 million TEU in the previous year.
The more revealing development occurred outside that group. Ports below the million-TEU threshold collectively handled 128.3 million TEU, up 21% from 106.4 million TEU in 2024. Their share of the estimated global market increased, while the share held by the million-TEU ports slipped from approximately 89% to 87%.
That does not suggest the largest hubs are losing their strategic importance. Most containerised trade still passes through high-capacity ports with deepwater berths, extensive crane fleets, large yards, feeder links, and increasingly sophisticated rail and road connections.
It does indicate that growth is spreading further through the network. Regional manufacturing development, new terminal capacity, changing sourcing locations, and revised liner-service patterns can all increase volumes at gateways that previously sat below the industry’s headline rankings.
The Far East remains dominant. Sixty-three million-TEU ports in the region handled a combined 531.2 million TEU in 2025, up 6%, accounting for more than half of the volume handled by ports above the million-TEU threshold.
North America ranked second among the reported trade areas, with 19 ports handling 70 million TEU, followed by northern Europe with 60.5 million TEU across 14 qualifying ports.
Growth was faster in several developing or expanding markets. African million-TEU ports increased throughput 12% to 39.3 million TEU, Latin America rose 11% to 45.3 million TEU, the Indian Subcontinent gained 10% to 35.3 million TEU, and the Middle East increased 8% to 44.6 million TEU.
Those figures matter because container volumes rarely increase in isolation. Expansion in manufacturing, assembly, export processing, consumer markets, or inland distribution creates demand for additional gateway capacity, while shipping lines are more likely to add direct calls where cargo density becomes sufficient.
At the top of the ranking, Shanghai remained the world’s largest container port with 55.06 million TEU, up 7% from 51.51 million TEU in 2024. Singapore retained second place at 44.66 million TEU after 9% growth.
Ningbo followed with 43.87 million TEU, an increase of 12%, while Shenzhen handled 35.41 million TEU and Qingdao 32.89 million TEU. Nineteen ports worldwide handled more than 10 million TEU during the year.
China remained the largest national market represented in the ranking. Its 30 ports above one million TEU processed a combined 306.4 million TEU, 6% more than in 2024. The United States followed with 55.55 million TEU across 13 qualifying ports.
Vietnam and India also recorded strong growth among their larger gateways. Vietnam’s four qualifying ports handled 25.88 million TEU, up 11%, while India’s four approached 20 million TEU after 12% growth.
Twelve ports moved above the million-TEU threshold during 2025, including Aqaba, Baltimore, Dar es Salaam, Gdynia, Manaus, Vizhinjam, and Wilhelmshaven. Montevideo was the only port to fall out of the group.
For supply-chain operators, port growth creates value only where landside capacity keeps pace. A terminal can add cranes and berth capacity more quickly than the time required to upgrade road links, rail terminals, customs operations, distribution centres, and inland depots serving the same volume.
Rapid growth can therefore move congestion away from the quay rather than remove it. Truck queues, rail-slot shortages, insufficient empty-container storage, and warehouse constraints can emerge when regional logistics infrastructure remains sized for the previous level of throughput.
The faster expansion among smaller ports may give shippers more routing alternatives, particularly where secondary gateways offer shorter inland distances or allow cargo to avoid established congestion points. It can also make network planning more complicated as manufacturers and forwarders compare additional combinations of port, carrier, feeder, rail, and road services.
Shipping lines face the same calculation. Calling at more gateways can move vessels closer to cargo origin and destination, but every additional port consumes schedule time and requires enough freight to justify terminal and operating costs.
The strongest regional gateways are therefore likely to attract direct services selectively rather than simply replacing large transshipment hubs. The billion-TEU figure is a useful marker of scale; the distribution behind it says more about how the network is changing.
Asia remains firmly at the centre of global container trade, but the edges of the network are becoming considerably busier — and landside infrastructure will have to absorb the consequences.