IN Brief:
- For the week ending 17 October 2026, US railroads reported 540,135 carloads and intermodal units, 8.5% above the equivalent week in 2025.
- Intermodal containers and trailers rose 12.6% to 308,015 units, while conventional carloads increased 3.5% to 232,120.
- Canadian intermodal traffic declined 0.7% as Mexican intermodal traffic grew 43.6%, from a much smaller base.
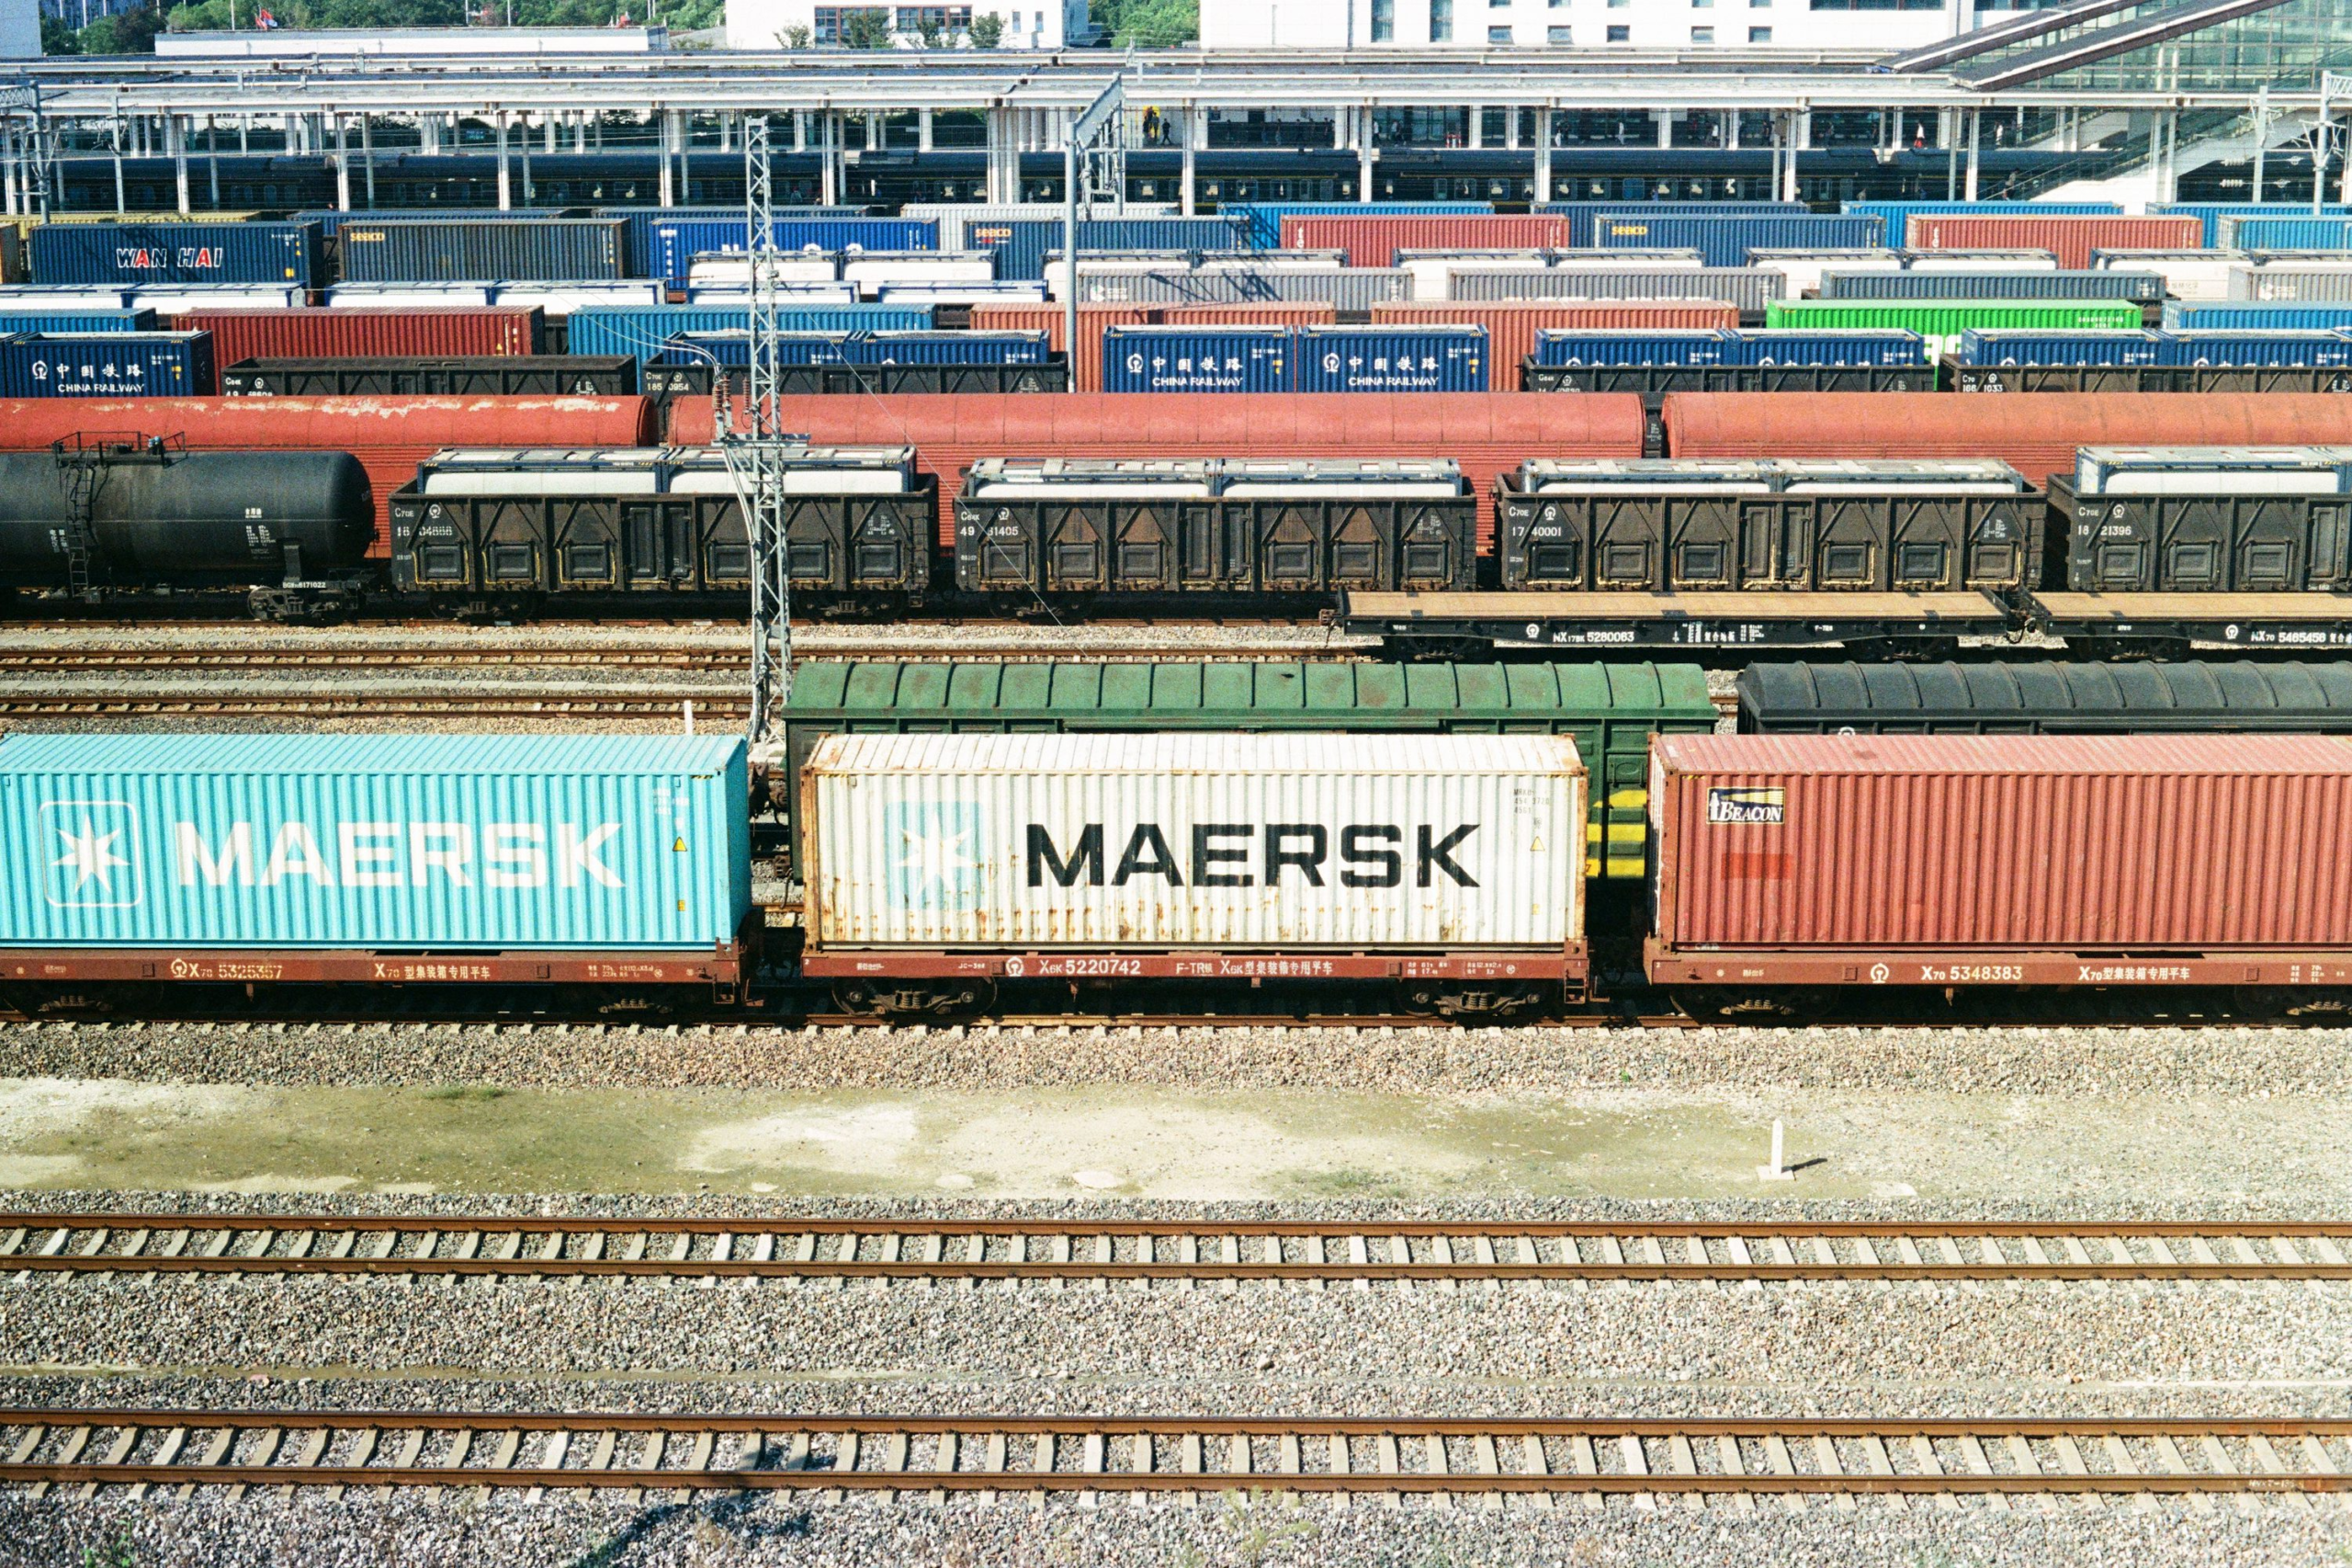
Association of American Railroads (AAR) figures show that US railroads handled 540,135 carloads and intermodal units in the week ending 17 October 2026, an increase of 8.5% from the corresponding week last year. Intermodal traffic accounted for 308,015 containers and trailers, up 12.6%, while conventional carloads increased 3.5% to 232,120. The growth rate was therefore appreciably higher for freight carried in transferable containers and trailers than for goods loaded directly into rail wagons, although the figures measure movements rather than weight or revenue.
A carload and an intermodal unit represent different kinds of freight movement. A container can move from a railway wagon to a road vehicle or another mode without its contents being unloaded; conventional carload traffic records railway wagons transporting materials such as grain, minerals or chemicals. Reporting the counts together provides a useful measure of rail activity, but a loaded mineral wagon, a container of components and an empty trailer do not necessarily carry comparable payloads. Changes in the number of units cannot be converted into changes in transported tonnage without additional cargo information.
During the preceding week, ending 10 October, US railroads recorded 534,256 carloads and intermodal units, up 7.2% from the equivalent 2025 week. That included 232,004 carloads and 302,252 intermodal units, with intermodal traffic growing 10.4% year on year. Both headline categories also recorded higher actual unit totals in the week ending 17 October, but the published growth rates compare corresponding weeks a year apart. Differences in operating days, dispatch schedules and seasonal flows mean a change between consecutive weeks should not be treated as a like-for-like measure of demand.
Nine of the ten carload commodity groups recorded increases from the equivalent 2025 week. Metallic ores and metals rose by 2,946 carloads to 23,306; grain increased by 1,470 to 22,486; and farm products other than grain, together with food, gained 1,103 carloads to reach 18,776. Nonmetallic minerals was the only group to decline, falling by 1,089 carloads to 32,428. These changes identify where more or fewer loaded wagons were recorded. They do not establish the weights carried, the value of the cargo or whether production at particular industrial sites increased.
The different commodity movements have operational consequences for rail networks because bulk freight and intermodal consignments use different terminal, wagon and handling arrangements. Metals traffic can require specialised wagons and access to production sites, while grain may move through loading facilities and export terminals aligned with harvest and processing schedules. The release does not attribute the increases to a specific change in manufacturing output, harvest volumes or modal choice. Its evidence is the recorded traffic by commodity group, rather than an explanation of every movement behind it.
Across the first 41 weeks of 2026, US railroads handled 9,374,717 carloads, up 2.7% from the equivalent 2025 period, and 11,687,964 intermodal units, up 4.6%. The combined total reached 21,062,681 units, an increase of 3.7%. These cumulative comparisons place the latest weekly increase alongside a longer period in which both traffic categories were above their 2025 levels. Intermodal movements have grown more quickly in percentage terms, although the series does not reveal the proportion of cargo transferred from road to rail, nor the amount of new freight generated.
The North American data include traffic reported by railroads in Canada and Mexico as well as the United States. Nine participating railroads across the three countries recorded 731,715 carloads and intermodal units in the week ending 17 October, up 7.2% year on year. Carloads increased 3.2% to 339,034, while intermodal units rose 10.8% to 392,681. This regional series includes the US contribution; it is not an additional volume to add to the US total. Its wider geographical coverage also means the headline growth rate should not be treated as a separate national US measure.
Canadian railroads handled 95,392 carloads, an increase of 3.3%, while their intermodal traffic declined 0.7% to 70,389 units. Mexican railroads recorded 11,522 carloads, down 1.6%, alongside 14,277 intermodal units, up 43.6%. That pronounced percentage rise in Mexican intermodal traffic came from a substantially smaller unit base than the US figure. Different directions and scales of movement across the three countries prevent the regional increase from describing identical conditions at individual crossings, terminals or industrial supply routes.
Moving an intermodal load also requires terminal lifting equipment, suitable wagons, available containers and trailers, rail paths and road collections at either end. A higher number of intermodal units handled nationally does not establish that every terminal has spare capacity or that dwell times have improved. Delays in unloading, releasing or collecting containers can persist even when linehaul train capacity is available. The weekly traffic series does not include comparable measures of those service conditions, so terminal performance and delivery reliability need separate evidence.
Further weekly figures will establish whether October’s growth persists across intermodal traffic and the industrial commodity groups that have increased. The current release confirms higher US rail unit volumes both for the week ending 17 October and across the first 41 weeks of the year. It does not show freight rates, tonne kilometres, changes in the road and rail shares of the same cargo market or the capacity available to a particular customer on a specific route.