IN Brief:
- WorldACD measured a 4% weekly increase in worldwide air cargo pricing in 12–18 October, with chargeable weight up 2%.
- Asia Pacific-origin chargeable weight rose 9%, while the region’s outbound aircraft capacity increased 6%.
- Asia Pacific–US pricing increased 6% on the week, against a 1% rise on the Asia Pacific–Europe corridor.
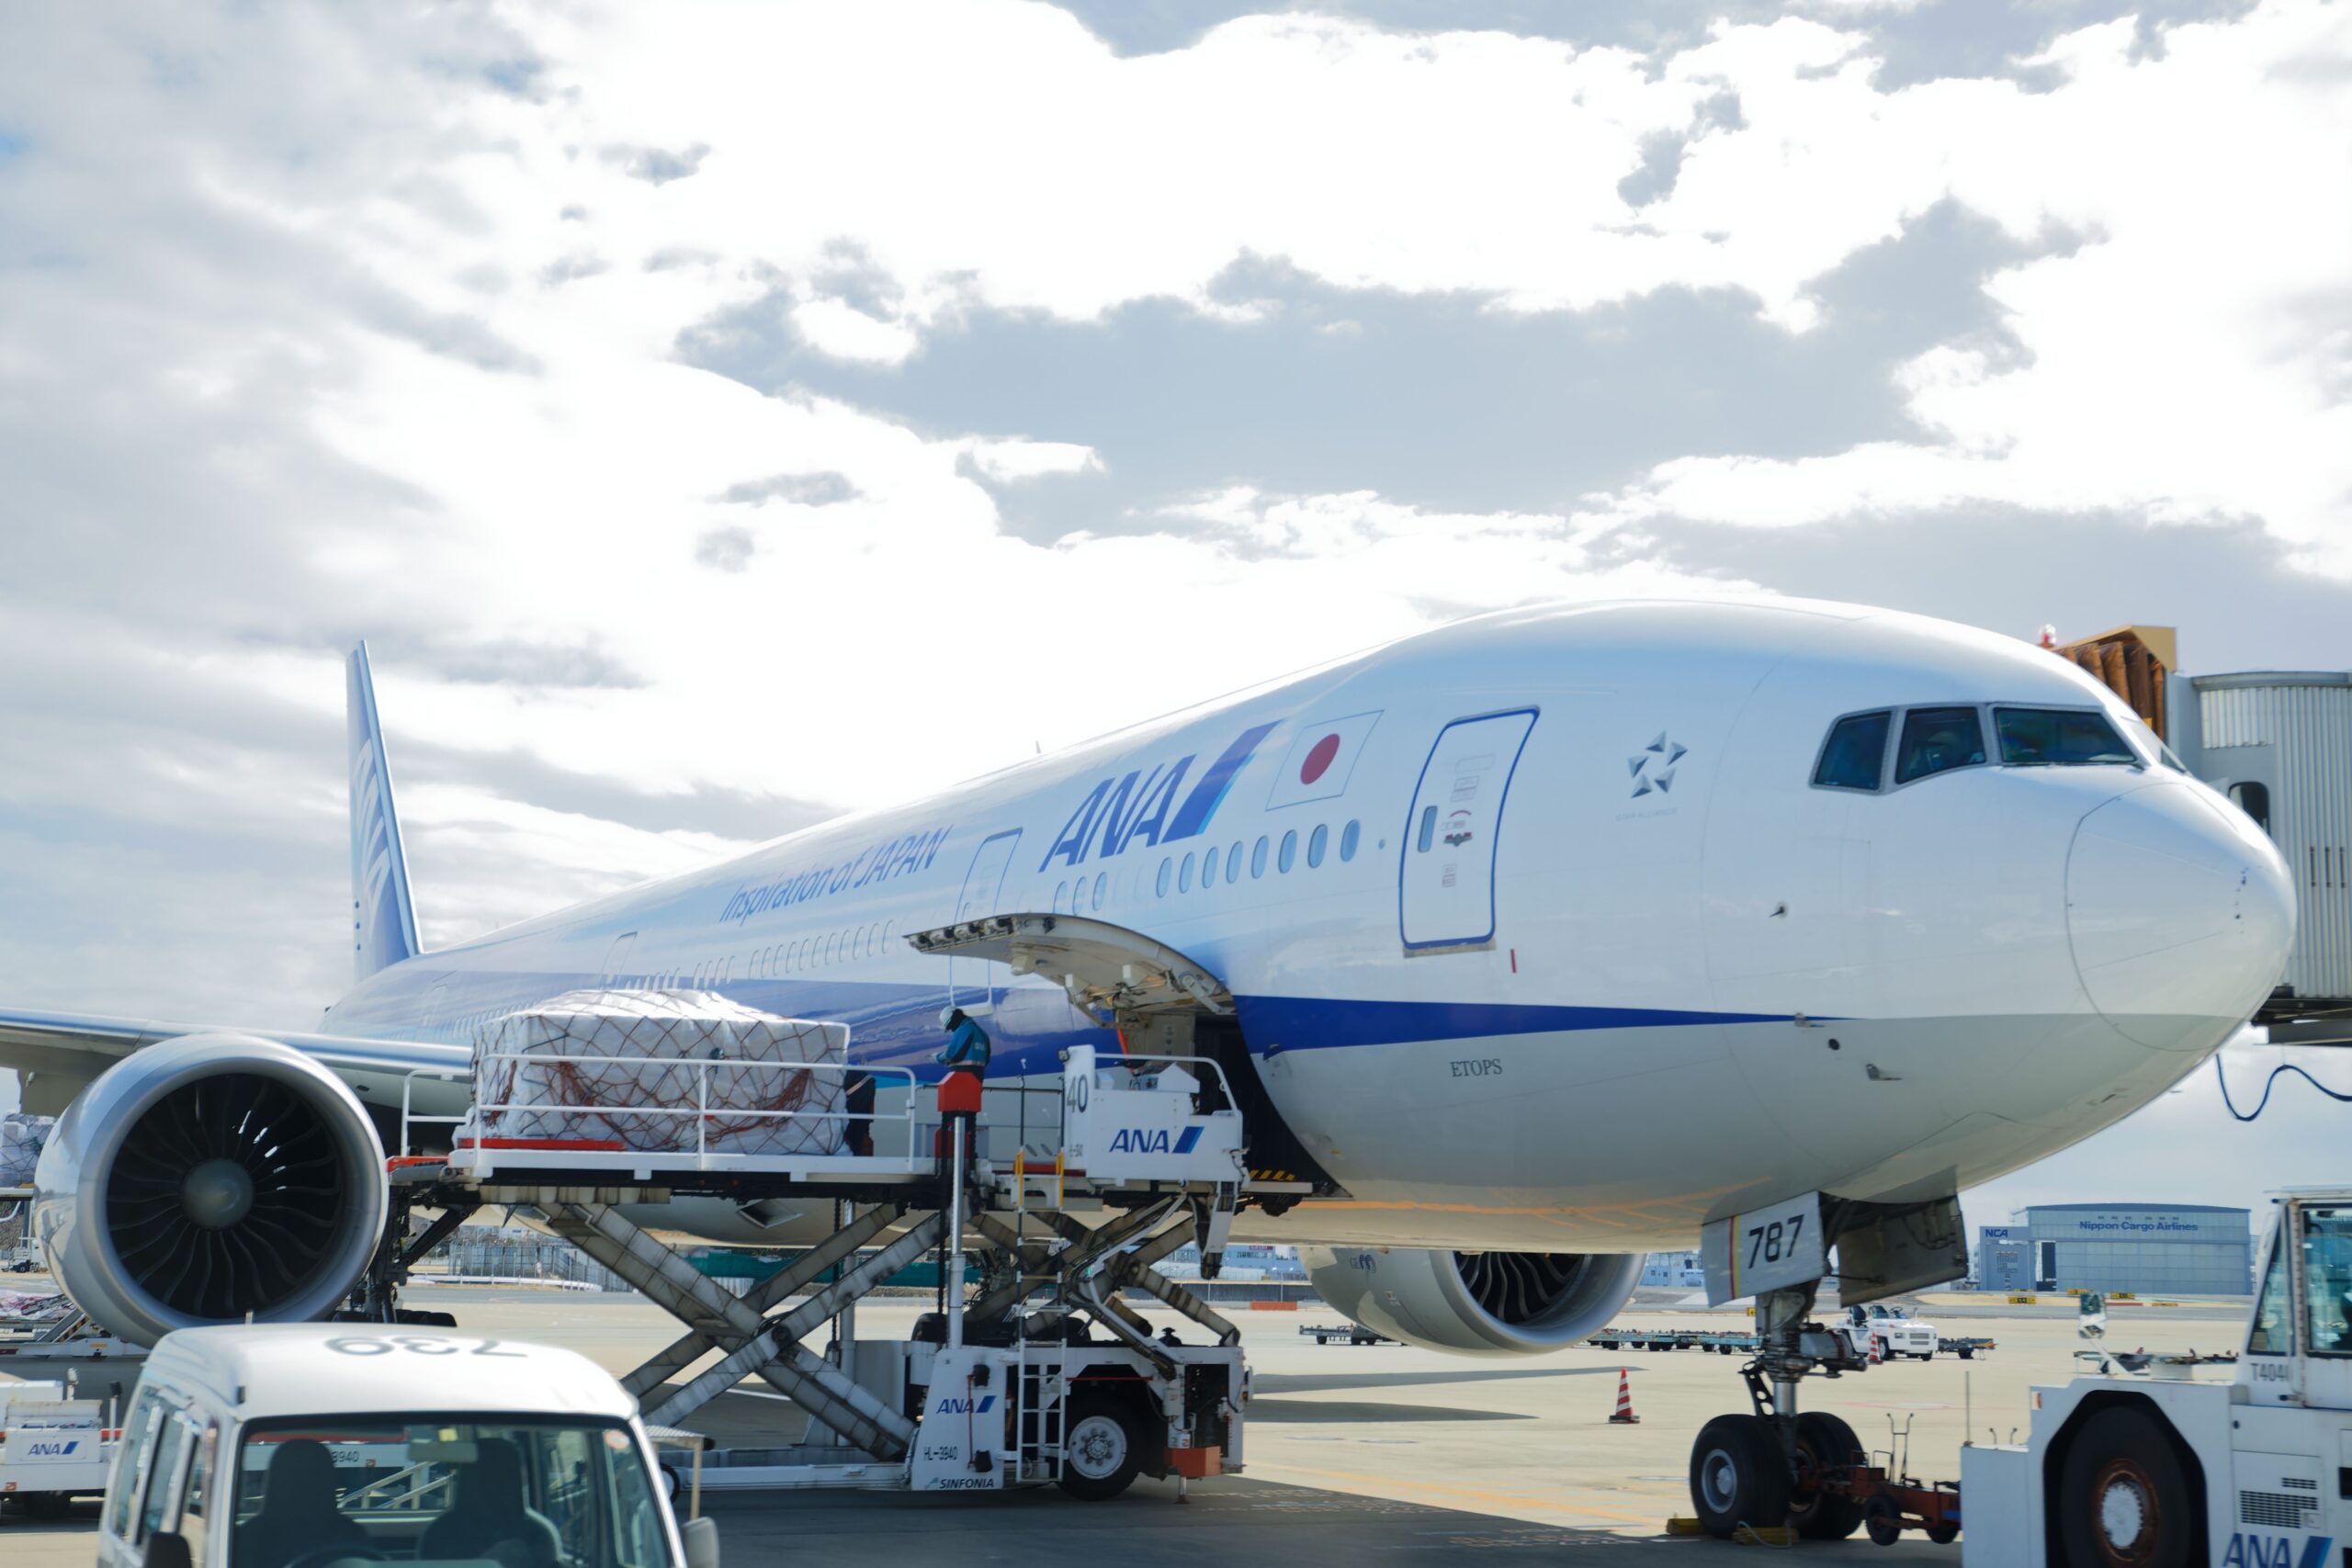
WorldACD has recorded a 4% rise in worldwide air cargo pricing as exports from Asian production centres resumed after the early-October holiday period. Its figures for the week of 12–18 October 2026 show global chargeable weight up 2% from the preceding week, with available capacity also 2% higher as airlines increased freighter operations after two weeks of cuts.
Asia Pacific origins accounted for the clearest rebound, with chargeable weight 9% above the preceding week. Cargo to Europe from the region rose 13%, while shipments to the United States were up 10%. Volumes declined from every other origin region. North America recorded a 5% reduction, partly reflecting national holidays in Canada and the United States, and Europe fell 2%. The aggregate recovery therefore arose from one major exporting region rather than a simultaneous rise in demand across the network.
The strongest short-term uplift in capacity also came from Asia Pacific, where airlines increased available space by 6%. European capacity grew 2%, while North America and Central and South America recorded 1% increases. Capacity contracted by 2% in both Africa and the Middle East and South Asia region. The global 2% increase follows two consecutive weekly reductions, indicating that additional lift was returned to the market as export consignments restarted.
The global pricing rise was also uneven. Origin rates increased 4% from Asia Pacific, 3% from Central and South America, 2% from the Middle East and South Asia, and 1% from each of Europe and North America. Africa was the exception, with a 4% decline. On the year-earlier comparison, the overall air cargo price index was almost 30% higher, although increases ranged from approximately 7% in Central and South America to 61% in the Middle East and South Asia.
Chargeable weight measures the billable quantity for an air consignment, using actual mass or volumetric mass under the carrier’s applicable tariff. An increase in this measure may reflect more pieces, heavier products, or a change in shipment mix. Capacity and pricing respond to the available aircraft and routes as well as the cargo tendered: a freighter with space on one trade lane cannot automatically relieve pressure on a different route or at a constrained airport.
Asia Pacific–US air cargo prices increased 6% week on week, against a 1% rise for cargo moving from Asia Pacific to Europe. Singapore-to-US rates jumped 23%, while rates from Japan to Europe fell 8%. The differences are material to procurement decisions because a regional average can hide a much larger change on the airport pair used by an individual manufacturer or forwarder. Transit options, uplift frequency, consolidation arrangements and the date a booking is accepted affect the final quotation.
On an annual basis, the Asia Pacific–US corridor was 41% more expensive than in the comparable 2025 week, compared with an increase of 25% to Europe. WorldACD also recorded 14% more chargeable weight moving from Asia Pacific to the US than a year earlier, whereas traffic from the same origins to Europe was 16% lower. Those contrasting directions provide stronger evidence of diverging lane conditions than a single global rate index. The figures do not isolate particular product categories as the cause of the changes.
Capacity increased in parallel with volume, rather than remaining fixed during the rebound. Aircraft space from Asia Pacific expanded 6% week on week, but the 9% growth in chargeable weight was larger, changing the balance between cargo offered and lift available from that region. WorldACD reported a 2% increase in worldwide capacity after two weeks of reductions. That recovery may be absorbed differently at individual airports, particularly where ground handling or scheduled departure slots constrain how quickly additional consignments can move.
The October rebound followed the Golden Week manufacturing pause, making the week-to-week comparison sensitive to a low previous base. WorldACD flagged a firmer potential transpacific peak while describing the European outlook as less certain. Policy changes affecting low-value e-commerce imports were scheduled for November, but the published week-42 data cannot establish their eventual effect on flown tonnage. Forward forecasts therefore need to distinguish the observed October movement from later demand assumptions.
Airlines deciding whether to add freighter departures face a different calculation from shippers booking an urgent consignment. Extra capacity requires aircraft, crews, airport slots and handling resources; the commercial return depends on how reliably the additional space can be filled. Shippers meanwhile pay for access to a specific routing and service level, not a global average. The next WorldACD observations will show whether the recovery in Asian export traffic was sustained after factories and forwarding schedules returned to normal.