IN Brief:
- Antwerp-Bruges handled 200.9m tonnes in January–September 2026, down 0.8% year on year.
- Container volumes rose 1.2% in TEUs as empty boxes increased 11.7% and laden boxes fell 1.3%.
- RoRo and dry bulk rose, while conventional general cargo and liquid bulk declined.
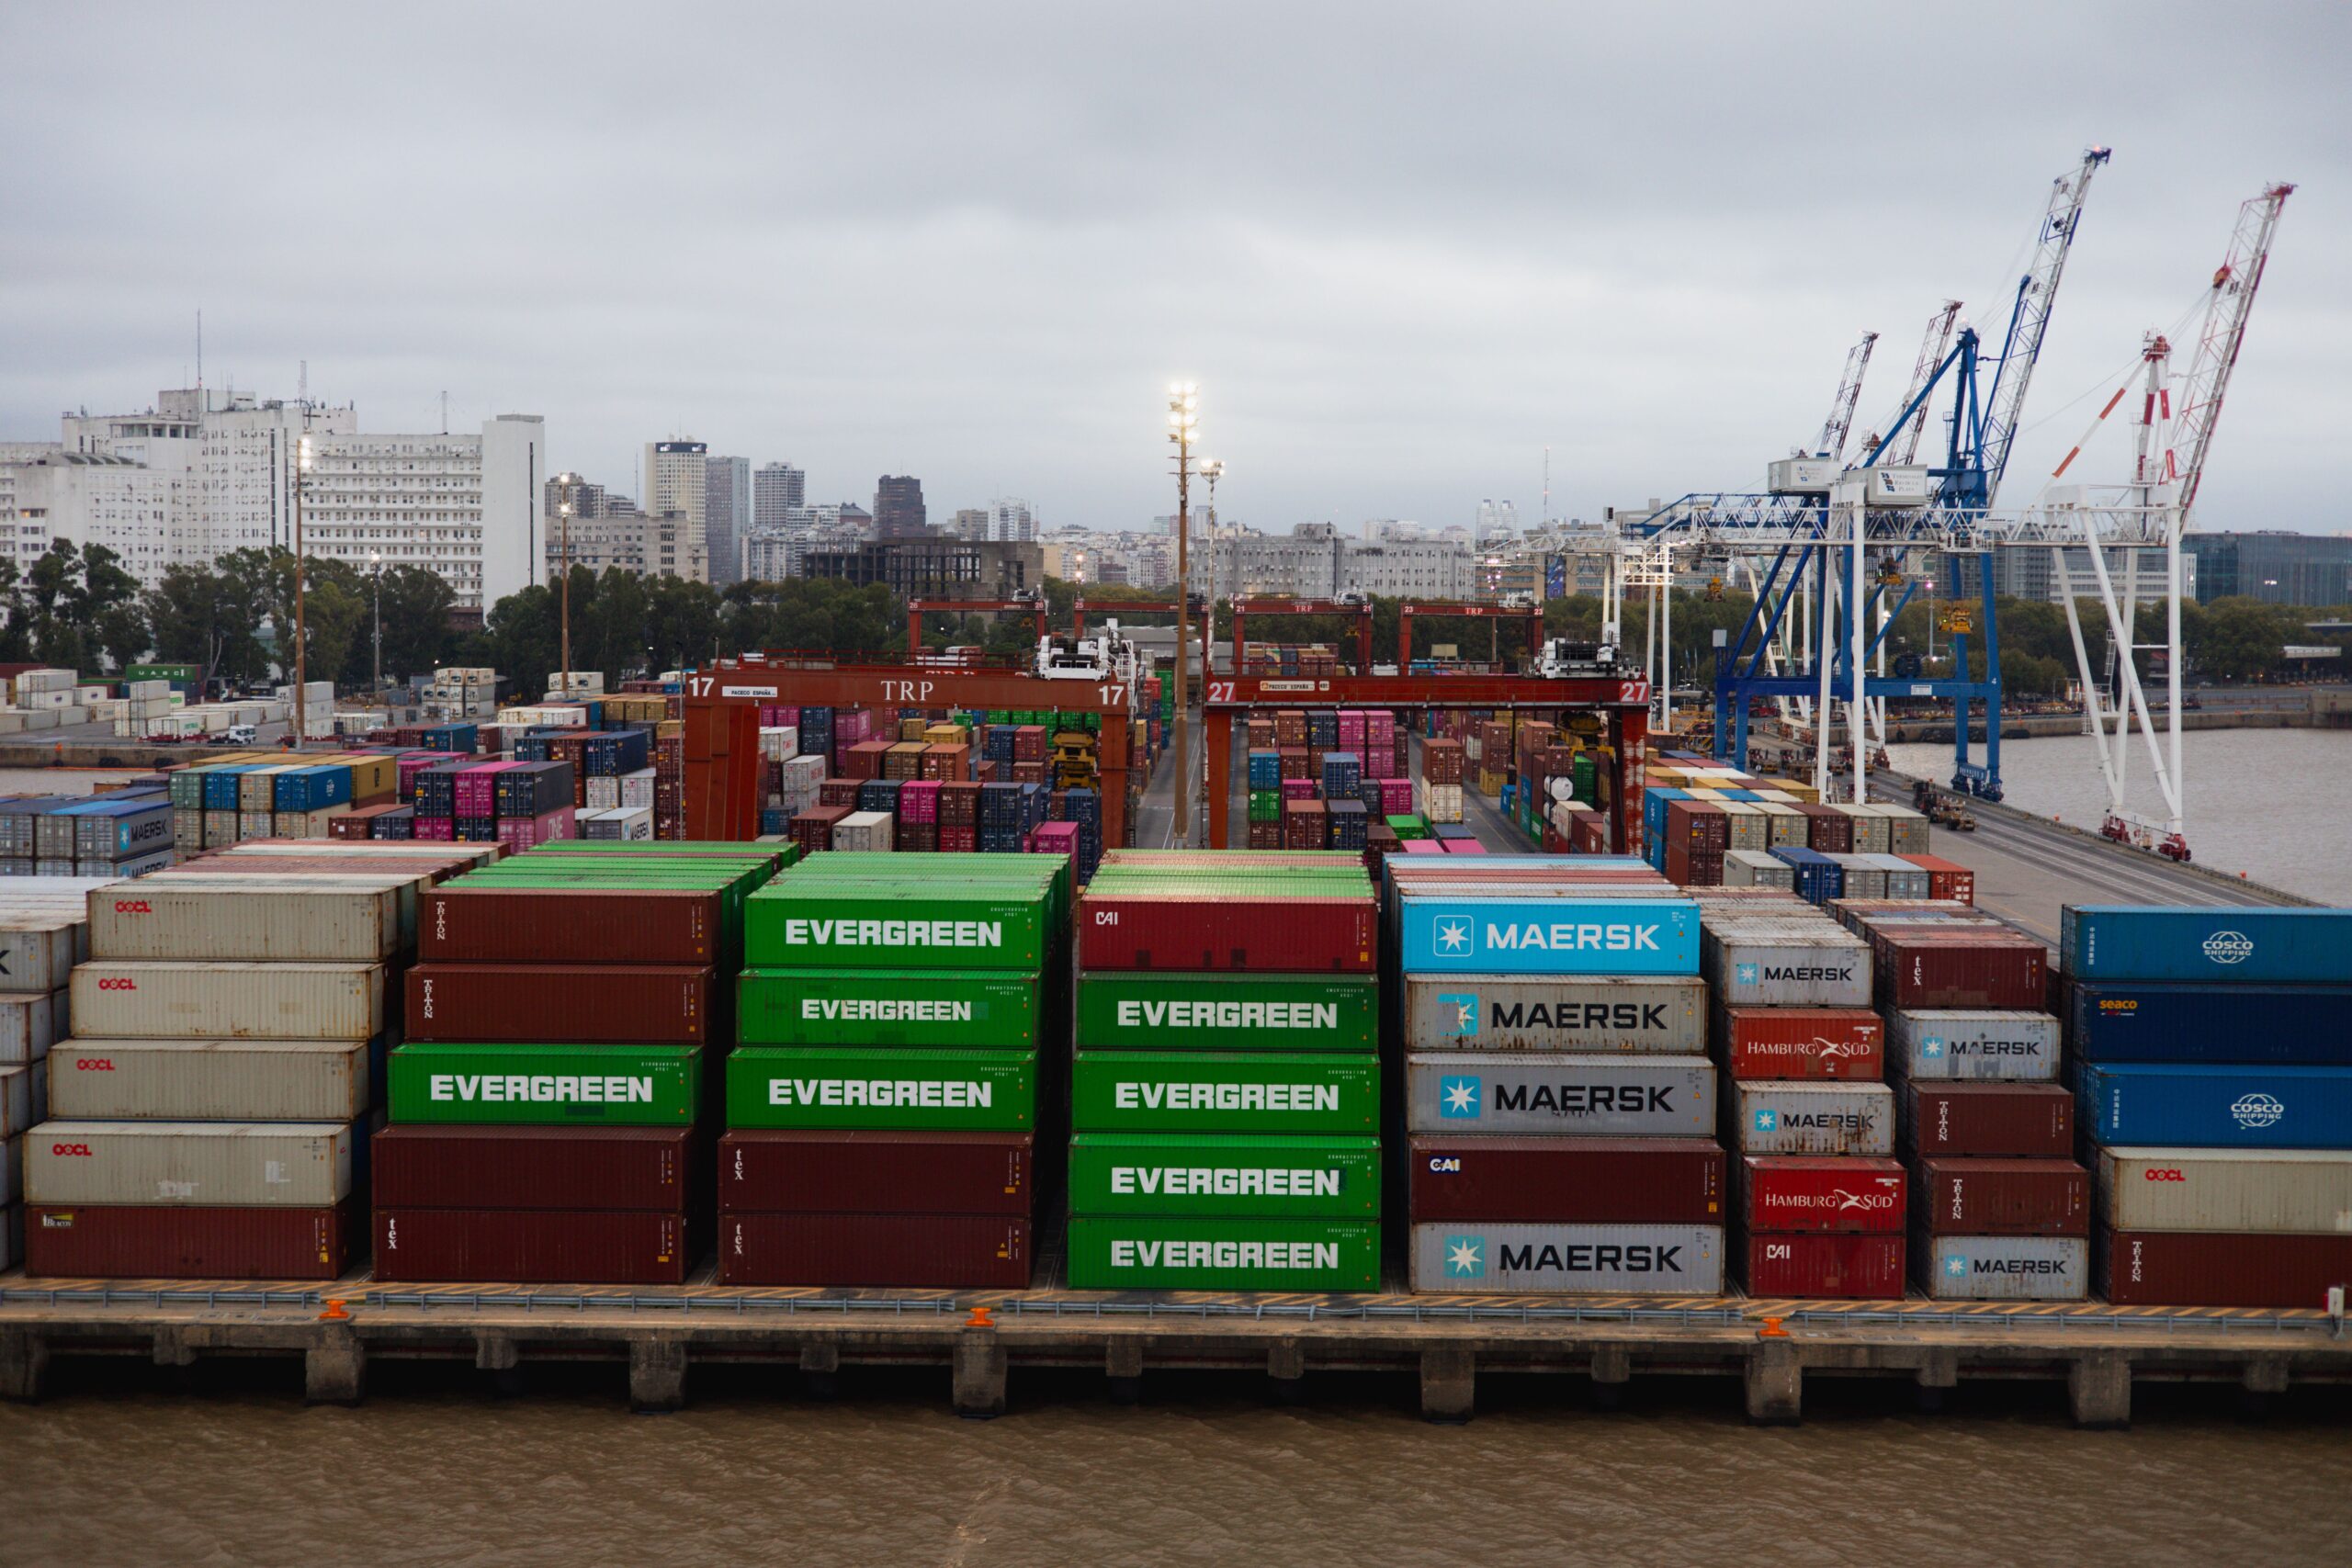
Port of Antwerp-Bruges handled 200.9 million tonnes of cargo in the first nine months of 2026, down 0.8% on the same period in 2025, despite its strongest container quarter since late 2020. Container throughput increased 1.2% in twenty-foot equivalent units (TEUs), according to figures released on 20 October, but most of the apparent improvement came from empty equipment movements. Full-container traffic and containerised cargo weight both declined, making the unit growth a poor standalone measure of industrial goods demand.
Empty-container movements rose 11.7% in TEUs over the nine months, while laden-container throughput fell 1.3%. Containerised cargo tonnage declined 0.6%. An empty box still occupies crane time, transport equipment and yard space, and contributes to the port’s TEU count even when it carries no traded goods. The different measures therefore describe separate burdens on port operations: box handling can increase while the physical volume of goods crossing the quay remains below the prior year’s level.
Container volumes recovered in August after several disruptions earlier in the year. Adverse weather, strikes affecting nautical services and an oil spill at Deurganck Dock contributed to difficulties in the first half, while a damaged container carrying hydrofluoric acid caused further disruption in July. Activity improved sufficiently for the third quarter to become the strongest since the fourth quarter of 2020. The recovery followed a series of interruptions to vessel access and terminal handling, leaving carriers to manage scheduled calls against the available operating windows.
Conventional general cargo declined 16.6%, including a 17.5% fall in iron and steel handling. The authority pointed to weak industrial demand, energy prices, steel quotas and the EU Carbon Border Adjustment Mechanism as pressures on the steel market. Liquid bulk also weakened, with fewer petroleum derivatives, chemicals and liquefied natural gas movements. These trades depend on specialised berths, tanks, pipelines or covered handling areas, so higher container crane activity does not offset lower utilisation or cargo flows across the entire port complex.
The port recorded 5.5% growth in roll-on/roll-off traffic, helped by a 9.3% increase in new cars, particularly from China and Japan. Cargo movements with Ireland and Scandinavia strengthened, while routes associated with the United Kingdom and Iberian Peninsula were weaker. Dry bulk increased 13%, supported by iron ore and other ores, although fertiliser throughput fell 1.1%. Within conventional general cargo, fruit and vegetable traffic rose 7.6%. The contrasts underline that the port’s mixed industrial cargo base does not follow a single demand pattern.
Conflict in the Middle East has also altered the routes and origin of freight reaching the Belgian gateway. The port reported no liquefied natural gas cargoes from Qatar since March and no diesel supplies from the Middle East since mid-May. Container lines have modified sailing schedules and introduced alternative routes for regional services. Container exports to the Persian Gulf fell by 70%, while exports to other parts of the Middle East increased to almost five times their previous level. These are different destinations within a disrupted trading region, and their contrasting changes have consequences for bookings, sailing itineraries and the timing of export consignments. The port provided the regional movement figures alongside its January–September cargo results.
The port links higher empty-container movements to rising imports and weaker exports, which have widened the imbalance in available equipment and increased the need to reposition boxes, particularly towards Asia. Carriers need containers in the right locations for future shipments, and an empty box can pass through quay and yard operations without adding to the weight of traded cargo. These movements consume capacity, but the published figures do not break down the activity by terminal or shipping service. The operating effect therefore varies according to the routes and handling arrangements used by individual carriers.
Shippers planning deliveries through Antwerp-Bruges now need to align cargo readiness, inland transport bookings and shipping documentation with route-specific sailing schedules. Terminal planners, meanwhile, can use expected vessel calls and confirmed cargo bookings to assign labour, yard positions and collection appointments, especially after interruptions to nautical access. The port’s nine-month statistics record handling volumes but provide no corresponding series for average vessel delays, freight charges or terminal productivity. Those operational measures would need separate evidence before drawing conclusions about service performance. Subsequent schedules and shipment records will show whether the recovery translates into sustained export and import movements rather than a temporary concentration of vessel calls.